


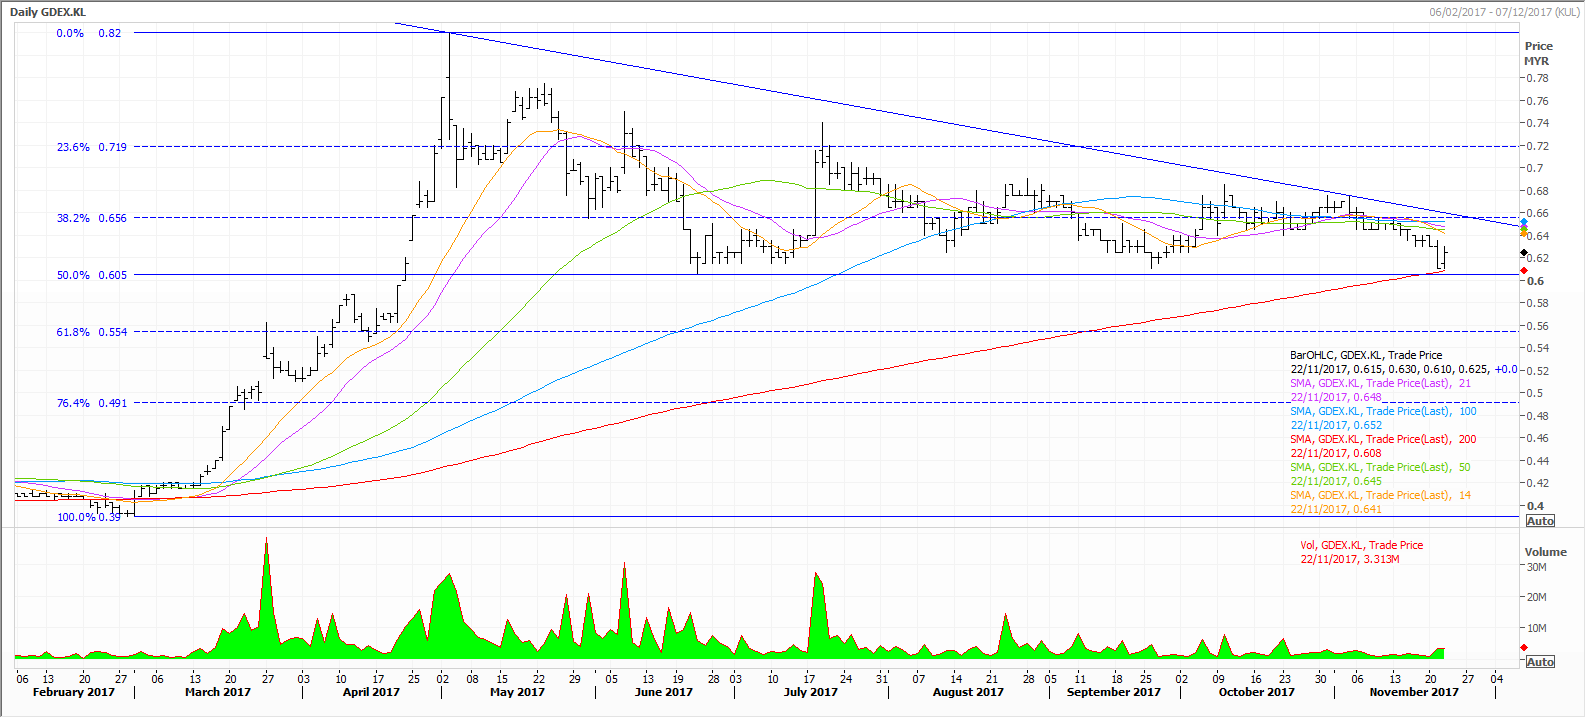
A MASSIVE rally pushed GD Express Carrier Bhd shares to an all-time high of 82 sen on May 3.
Soon after that, in the wake of apparent profit-taking selling, prices came under pressure to retreat, which witnessed this stock pulling back to a two-month low of 60.5 sen on June 22, undergoing a correction process.
Thereafter, GDex generally fluctuated with a mild negative bias amid continuous profit-taking liquidation offsetting sporadic buying.
While this stock consolidated, the shares tested the lowest 200-day simple moving average (SMA) line on Tuesday but they avoided a breakdown, as a better performance on the principal market helped soothe investor sentiment and led prices to a rebound on bargain hunting on Wednesday.
Based on the daily chart, GDex carved out a descending triangle pattern following a period of correction and consolidation process recently.
Theoretically, a descending triangle formation is a bearish pattern and it usually forms during a downtrend as a continuation pattern.
With prices flirting at the lower end of the existing bearish chart pattern, this counter is in great danger of breaking down and if that happens, it will alter the technical landscape from bullish to bearish going forward.
A crack of the 60.5 sen floor will signal the continuation of a downtrend, which may drag prices down to the 55.5 sen level, which is the 61.8% Fibonacci retracement (FR) of the previous massive rally.
The next lower support is pegged at the 76.4% FR of 49 sen.
On the indicators, the daily slow-stochastic momentum index and the 14-day relative strength index were seen ticking up from the bottom, implying prices are likely to firm in the immediate term on technical recovery.
However, the upside may be capped, as the moving average convergence/divergence histogram retained the sell call, unless the six-month-old declining trend line, resting at approximately the 66 sen level, is taken out convincingly.
The comments above do not represent a recommendation to buy or sell.
Already a subscriber? Log in
The Star Festive Promo: Get 35% OFF Digital Access
Cancel anytime. Ad-free. Unlimited access with perks.